
Risk Radar — Identify Stalled Deals & At-Risk Reps in SuiteCRM
Sales managers often waste hours every week manually auditing CRM records to answer one critical question: “Which reps are accumulating risk?” Revenue Engine AI eliminates this burden with the Risk Radar view — a team-wide risk distribution chart that surfaces which reps are carrying the most stalled deals and inactivity risk, before the quarter is lost.
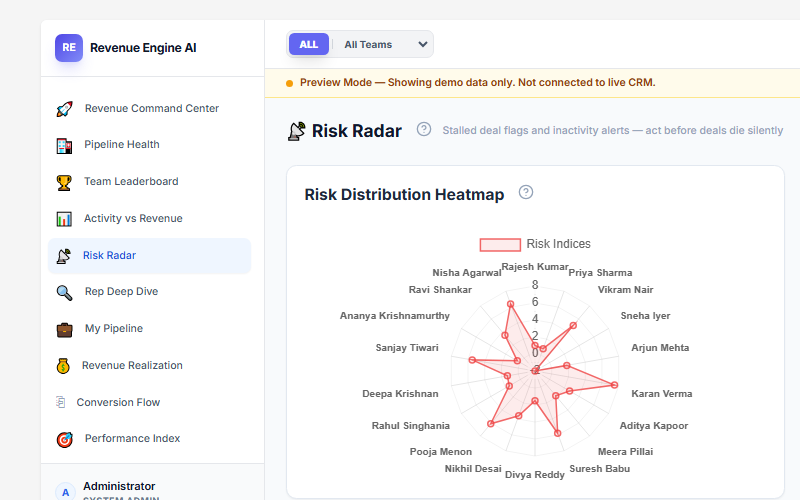
The Risk Distribution Heatmap
The central element of the Risk Radar view is a radar (spider) chart called the Risk Distribution Heatmap. Every active sales rep in your team appears as a spoke on the chart. The further a rep’s point extends from the centre, the higher their risk index.
What the risk index measures
Each rep’s risk index is a composite of two real-time signals drawn from your SuiteCRM data:
- Stalled deals (14+ days): Any opportunity assigned to the rep that has had no stage change in 14 or more days. The more stalled deals a rep carries — and the longer they have been stalled — the higher the risk contribution.
- Rep inactivity (7+ days): Revenue Engine AI queries the
calls_opportunitiesandmeetings_opportunitiesjoin tables. If the rep has not logged a call or meeting against an open deal in 7 or more days, an inactivity flag is triggered and added to their index.
A rep with a small, active pipeline and no stalled deals plots close to the centre — low risk. A rep with multiple stalled deals and several weeks of silence plots far out on the web — high risk, requiring immediate attention.
How to read the chart
- Reps close to the centre: Healthy — low stall count, recent activity logged.
- Reps extending toward the outer ring: Elevated risk — either multiple stalled deals, extended inactivity, or both. These reps should be in your next 1:1.
- Use the Team filter in the header to narrow the heatmap to a single team or sub-team, making it easier to spot risk patterns within a specific group.
Action Required (Critical Flag) Panel
To the right of the heatmap, the Action Required panel surfaces the single most critical risk in your current team view. When a rep’s combined risk index exceeds the critical threshold, this panel displays their name and a summary of the issue — prompting an immediate response.
When no rep has crossed the critical threshold, the panel displays: “No critical risk detected in current focus.” This is a good-news state — your team’s pipeline is moving and activity is current.
What triggers a Critical Flag
- A rep with 5 or more stalled deals simultaneously
- A rep who has logged no activity against any open deal for 14+ days
- Combination of high stall count and extended silence exceeding the composite threshold
Action trigger: A Critical Flag in this panel warrants a same-day conversation — not a scheduled 1:1. Use Rep Deep Dive to review that rep’s full deal list and identify which specific deals to address first.
Using Risk Radar in Your Weekly Workflow
Before your team meeting
- Open Risk Radar and set the Team filter to your group.
- Identify the 2–3 reps extending furthest from the centre on the heatmap.
- For each of those reps, open Rep Deep Dive to see their deal list with silence badges (Amber = 8–20 days no contact, Rose = 21+ days).
- Prepare one specific deal question per rep rather than a generic status request.
Before a 1:1 coaching session
- Check the Action Required panel for any critical flag on the rep you’re meeting.
- Note their position on the heatmap vs last week — has their risk index improved or worsened?
- Use My Pipeline to see the rep’s own deal view with close-date risk badges and Next Best Action prompts.
How Risk Radar connects to other views
| Question | Go to |
|---|---|
| Which specific deals are stalled for this rep? | Rep Deep Dive — deal list with silence badges |
| What’s the deal card the rep sees? | My Pipeline — rep’s risk-sorted deal view |
| How does risk compare to revenue across the whole team? | Activity vs Revenue — correlation scatter plot |
| How many stalled deals are flagged team-wide? | Revenue Command Center — HIGH_STALL_COUNT and STALL_WARNING signals |
| What is this rep’s composite performance score? | Team Leaderboard — Risk column + Systems Index score |
Stall & Inactivity Thresholds — Reference
| Signal | Threshold | Where it appears |
|---|---|---|
| Deal stall flag | No stage change for 14+ days | Risk Radar heatmap, Revenue Command Center signals (HIGH_STALL_COUNT, STALL_WARNING) |
| Rep inactivity flag | No call/meeting logged to any open deal for 7+ days | Risk Radar heatmap, Rep Deep Dive coaching flag |
| Deal silence badge — Amber | 8–20 days no last-touch activity on a specific deal | Rep Deep Dive deal list, My Pipeline cards |
| Deal silence badge — Rose | 21+ days no last-touch activity | Rep Deep Dive deal list, My Pipeline cards |
Data dependency: Stall and inactivity signals rely on calls and meetings being linked to opportunity records in SuiteCRM. If reps are logging activity without linking it to deals, the risk indices will appear artificially high. Use Settings → Data Health to verify that activity linking is working correctly.
Revenue Engine AI v1.7.2 · Built by Zybroz · support@zybroz.com