
Dark Mode, Sidebar & Date Range — UI Preferences Guide
Revenue Engine AI includes several interface preferences that let each user tailor the dashboard to their working style. These settings persist between sessions so you do not need to reconfigure them each time you open the dashboard. This guide covers the three main interface controls: Dark Mode, sidebar navigation, and the date range picker.
Dark Mode
Version note: Dark Mode was introduced in v1.7.1. If you are running an earlier version, the Dark Mode toggle in Settings will show “Coming soon in a future release.” Upgrade to v1.7.1 or later to access this feature.
Toggling Dark Mode On and Off
Dark Mode is controlled by a Moon / Sun icon toggle located in the dashboard header, to the right of the navigation controls. Click it once to switch between dark and light modes. Your preference is saved automatically to your browser’s localStorage and will persist the next time you open the dashboard — even after a SuiteCRM session logout and re-login.
What Dark Mode Covers
The .reai-dark CSS palette introduced in v1.7.1 applies to every component in the dashboard:
- Sidebar — background, nav links, active state, section dividers
- Header — top bar, logo area, controls
- Cards and KPI tiles — background surfaces, text, metric values
- Tables — header rows, alternating row colours, border lines
- Charts — axis labels, grid lines, tooltip backgrounds
- Badges — risk badge colours adjusted for dark contrast
- Modals — AI Insights panel, help modal overlay
- Scrollbars — styled to match the dark palette
- Settings panel — the Settings dark mode toggle stays in sync automatically via a custom browser event
Dark Mode and the Settings Panel
There is also a Dark Mode toggle inside Settings → View Preferences. Both the header toggle and the Settings toggle control the same preference — changing one automatically updates the other. You do not need to visit Settings to change the mode; the header toggle is the quickest route.
Note: Dark Mode preference is stored per-browser. If you use Revenue Engine AI on multiple devices or browsers, you will need to set the preference separately on each.
Sidebar Navigation
Expanded vs Icon-Only Mode
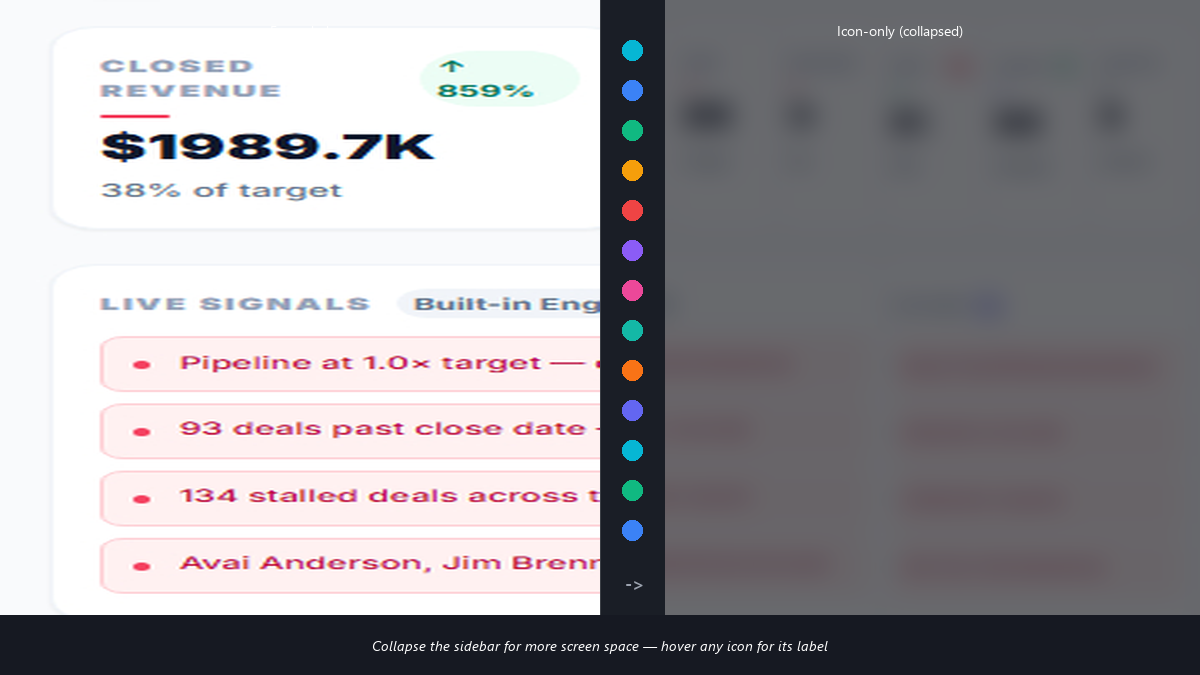
The left sidebar lists all 13 dashboard views. It can be collapsed to an icon-only mode to give the main content area more horizontal space — particularly useful on smaller screens or when presenting the dashboard in a meeting.
To collapse the sidebar, click the collapse arrow at the bottom of the sidebar panel. The sidebar narrows to show only the view icons. Hover over any icon to see its label in a tooltip. Click the expand arrow to restore full labels.
Sidebar View Order
The sidebar displays views in a fixed order that follows the natural sales workflow:
- Revenue Command Center
- Pipeline Health
- Team Leaderboard
- Activity vs Revenue
- Risk Radar
- Rep Deep Dive
- My Pipeline
- Revenue Realization
- Conversion Flow
- Performance Index
- Account Intelligence
- Forecast Accuracy Tracker
- Data Audit & Diagnostics (admin only)
Individual views can be hidden from the sidebar using Settings → Dashboard Modules. Hidden views remain available to admins but do not appear in the sidebar for the role they are hidden from. See the Dashboard Modules Toggle guide for details.
Date Range Picker
Overview
The date range picker appears in the dashboard header and controls the time window for all data displayed across every view. Changing the date range immediately updates KPIs, charts, tables, and risk signals throughout the entire dashboard — no page reload required.
Your selected range persists to localStorage. When you return to the dashboard, it will still show the range you last used.
The Date Range Presets
The picker is divided into three groups:
| Preset | Period covered | Best used for |
|---|---|---|
| CALENDAR PERIODS | ||
| This Week | Monday → today | Weekly pipeline reviews |
| Last Week | Previous Mon–Sun | Weekly performance wrap-ups |
| This Month | 1st → today | Month-to-date tracking |
| Last Month | Full previous calendar month | Month-end reporting |
| This Quarter | Quarter start → today | QBR preparation, attainment tracking |
| Last Quarter | Full previous quarter | Historical performance reviews |
| This Year | Jan 1 → today | Annual target progress |
| Last Year | Full previous calendar year | Year-over-year comparisons |
| ROLLING PERIODS | ||
| Rolling 30 Days | Last 30 days from today | Monthly trend without calendar boundary |
| Rolling 90 Days | Last 90 days from today (default) | Quarterly view, aligns with most deal cycles |
| Rolling 6 Months | Last 6 months from today | Half-year performance overview |
| Rolling 12 Months | Last 12 months from today | Annual trend without fiscal year boundary |
Custom Date Range
Select Custom Range from the picker to define a precise start and end date using the calendar input. Custom ranges are useful for:
- Analysing a specific campaign or event period
- Matching a non-standard fiscal quarter
- Comparing a specific 45- or 60-day window
- Investigating a period around a particular hire or territory change
How the Date Range Affects KPI Delta Badges
The Revenue Command Center displays period-over-period delta badges (↑ / ↓) on each KPI tile. These compare the current period against the immediately preceding period of the same length. For example:
- If you select This Quarter (90 days), the delta compares this quarter against the prior 90-day period.
- If you select Last 30 Days, the delta compares against the 30 days before that window.
The delta calculation always uses a same-length prior period — it does not compare to the same calendar period from a previous year. This makes short-term trend analysis consistent regardless of which preset you choose.
How the Date Range Affects Forecasting
The Forecast Accuracy Tracker and the Revenue Command Center attainment percentage both reference the Quarterly Revenue Target configured in Settings. The attainment figure is calculated for the selected period, not always for the full quarter. If you select “Last 30 Days,” attainment reflects only what was closed in those 30 days against the full quarterly target — which will typically appear low. Switch to “This Quarter” for meaningful attainment figures.
Preference Storage: What is Saved and Where
| Preference | Stored in | Scope |
|---|---|---|
| Dark Mode on/off | Browser localStorage |
Per browser / per device |
| Date range selection | Browser localStorage |
Per browser / per device |
| Sidebar expanded/collapsed | Browser localStorage |
Per browser / per device |
| AI API key (BYOK) | Browser localStorage |
Per browser / per device — never sent to Zybroz servers |
Privacy note: All preferences stored in
localStorageremain entirely within the user’s browser. They are not transmitted to Zybroz or stored in SuiteCRM’s database. Clearing browser data or switching to a different browser will reset these preferences to their defaults.
Revenue Engine AI v1.7.2 · Built by Zybroz · support@zybroz.com