
Conversion Flow — Lead-to-Revenue Funnel Analysis
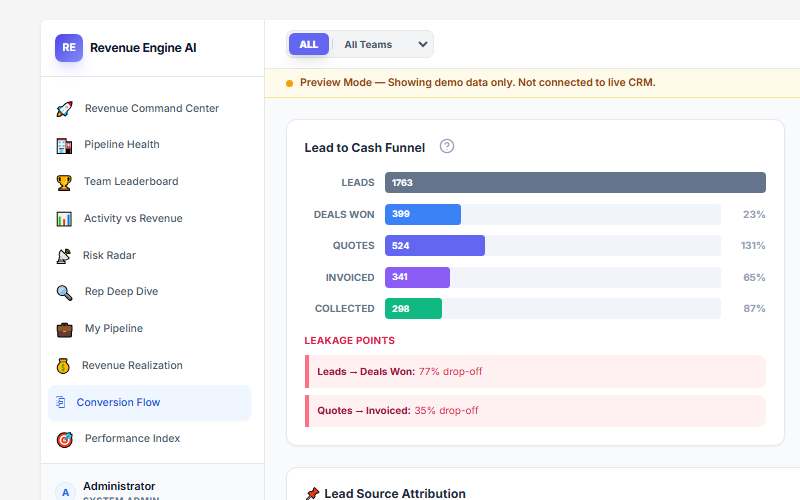
The Conversion Flow view (titled “Lead to Cash Funnel” in the UI) maps the entire journey from initial lead capture through to collected cash. It shows your team’s conversion rate at every stage so you can pinpoint exactly where deals are being lost and which lead sources drive the most revenue.
Most CRM reporting shows you a result: “We won 22% of opportunities this quarter.” Conversion Flow shows you the mechanics across five stages, highlights the two biggest leakage points automatically, and breaks down conversion by rep. Each gap is a coaching and process improvement target.
The Five Funnel Stages
The funnel tracks records through five sequential stages, reading top to bottom. Each stage shows the record count and the conversion rate from the stage above it.
| Stage | SuiteCRM Source | What It Counts |
|---|---|---|
| 1. Leads | Leads module | All leads created during the selected period (requires Leads Module toggle On in Settings → Data Sources) |
| 2. Deals Won | Opportunities module | Closed-won opportunities in the period — not all opportunities, only won deals |
| 3. Quotes | AOS Quotes module | Quotes created in the period (may exceed Deals Won count if quotes are raised before close) |
| 4. Invoiced | AOS Invoices module | Invoices issued against orders or directly against opportunities |
| 5. Collected | Payment records | Cash collected — the final revenue realisation endpoint |
Note: If your SuiteCRM instance does not use the Quotes, Invoices, or payment modules, those stages will show zero. This is expected — use the Deals Won count for pipeline-to-win coaching and the Revenue Realization view for the full quote-to-cash funnel detail.
Leakage Points
Below the funnel bars, a Leakage Points section automatically highlights the two stages with the highest drop-off percentage. These are your biggest conversion bottlenecks. For example:
- Leads → Deals Won: 77% drop-off — only 23% of leads are converting to closed deals. Marketing or lead quality issue.
- Quotes → Invoiced: 35% drop-off — a third of quotes are never invoiced. Negotiation or approval process breakdown.
Reading Drop-Off Between Stages
The gap between any two adjacent stages is your drop-off rate — the percentage of records that did not progress to the next stage. Each drop-off has a different root cause and requires a different response.
High Lead → Deals Won Drop-Off
A large percentage of leads never convert to closed-won deals. Common causes:
- Leads are being generated by marketing channels that attract low-intent contacts
- Reps are not qualifying or converting leads promptly (check age of unconverted leads)
- Lead scoring or routing is sending the wrong leads to the wrong reps
Action: Cross-reference with the Lead Source Attribution panel to identify which sources convert best. Deprioritise low-converting sources.
High Quote → Invoiced Drop-Off
Quotes are being generated but not converting to invoices. Common causes:
- Pricing objections not resolved during negotiation
- Quotes expiring before follow-up occurs
- Internal approval delays preventing invoice creation
- Competitor wins at the final commercial stage
Action: Review quote-level data in SuiteCRM. The Leakage Points section will flag this as a top bottleneck if the drop-off is significant. Focus 1:1 coaching on reps with low quote-to-invoice conversion in the Rep Conversion Rates table.
High Invoiced → Collected Drop-Off
Invoices are issued but payment is not being collected. Common causes:
- Long payment terms or slow finance team processing
- Invoice disputes or incorrect billing
- Customer cash flow issues
Action: This is a finance/accounts-receivable issue, not a sales process issue. Escalate to finance rather than coaching reps. Check with your finance team whether invoice data is being accurately entered into SuiteCRM.
Per-Rep Conversion Table
Below the funnel chart, the Conversion Flow view displays a per-rep breakdown. This table shows each rep’s individual lead-to-opportunity and opportunity-to-close conversion rates for the selected period.
Rep Conversion Rates table columns
| Column | What it shows |
|---|---|
| Rep / Team | Rep name and team assignment |
| Leads | Total leads assigned to this rep in the period |
| Won | Closed-won deals count |
| Conv% | Won ÷ Leads — overall conversion rate |
| K | Total closed-won revenue in thousands |
How to use the table
- Highest Conv% identifies your most efficient closers — learn from their approach.
- High revenue but low Conv% — rep may be working large but infrequent deals; check pipeline depth for next quarter.
- Low Conv% and low revenue — structured coaching plan required; use Rep Deep Dive to identify the specific funnel stage where deals are lost.
RBAC note: Managers see only the reps in their security group. Reps see only their own row. Admins see the full organisation.
Lead Source Attribution Panel
The Lead Source Attribution panel (introduced in v1.5.0) appears alongside the funnel chart. It breaks down which lead sources — Inbound, Cold Outreach, Referral, Campaign, etc. — are generating your opportunities and, more importantly, which are generating your closed revenue.
Key questions the attribution panel answers
- Which lead source generates the most leads by volume — and is that also the highest-converting source?
- Are you overinvesting in a low-quality channel? (High volume, low conversion = poor ROI on lead gen spend)
- Where should SDR or marketing budget be concentrated next quarter?
Example: Web Site may generate the highest lead volume (29%) while Referral generates fewer leads but higher-quality ones. Compare the Conv% column in the Rep Conversion Rates table against lead sources to identify which channels produce the most closable pipeline.
Data dependency
The attribution panel requires that the Lead Source field is populated on SuiteCRM Lead records. If your team does not capture this field, all leads will group under “Unknown” and the panel will not provide actionable insight. Standardising lead source values is a quick data hygiene win that unlocks this analysis.
Settings Dependencies
Two Settings toggles directly affect what Conversion Flow displays:
| Setting | Location | Effect if disabled |
|---|---|---|
| Leads Module | Settings → Data Sources | The Lead stage disappears from the funnel. Conversion Flow starts at Opportunities. |
| Activity Data | Settings → Data Sources | Activity-linked conversion data is excluded. Per-rep table still shows but activity context is missing. |
If your Conversion Flow funnel is missing its top stage (Leads), check that Leads Module is toggled On in Settings → Data Sources and that SuiteCRM Lead records exist within the selected date range.
Linking Conversion Flow to Other Views
| Follow-up Question | Go To |
|---|---|
| Which deals are stalling before they reach quote stage? | Risk Radar — 14-day stall detection |
| Why is one rep’s conversion rate significantly lower? | Rep Deep Dive — individual pipeline and deal list |
| What is the quote-to-invoice revenue realisation rate? | Revenue Realization — quote-to-cash funnel view |
| How does this rep’s activity compare to their conversion? | Activity vs Revenue — efficiency quadrant plot |
| What is the team’s overall win rate and average deal size? | Revenue Command Center — KPI tiles |
Revenue Engine AI v1.7.2 · Built by Zybroz · support@zybroz.com