
Maximize SuiteCRM Pipeline Health & Account Intelligence
The native reporting tools in SuiteCRM often require manual configuration, spreadsheet exports, and hours of pivoting to answer fundamental sales questions. Revenue Engine AI solves this by providing a high-fidelity, real-time analytics layer that transforms raw CRM data into a “Zoom” tool for sales intelligence: Company → Team → Rep → Deal → Activity.
By integrating the Pipeline Health and Account Intelligence views, sales managers and VPs can identify bottlenecks and concentration risks in a single click — mid-quarter, not at year-end.
Pipeline Health vs Account Intelligence — What Each View Answers
- Pipeline Health: Focuses on the “how” and “where” — how deals are progressing through the sales cycle, and where they are accumulating or stalling.
- Account Intelligence: Focuses on the “who” and “how much” — which accounts carry the most pipeline weight, and where concentration risk lies.
Stage Distribution and Bottleneck Identification
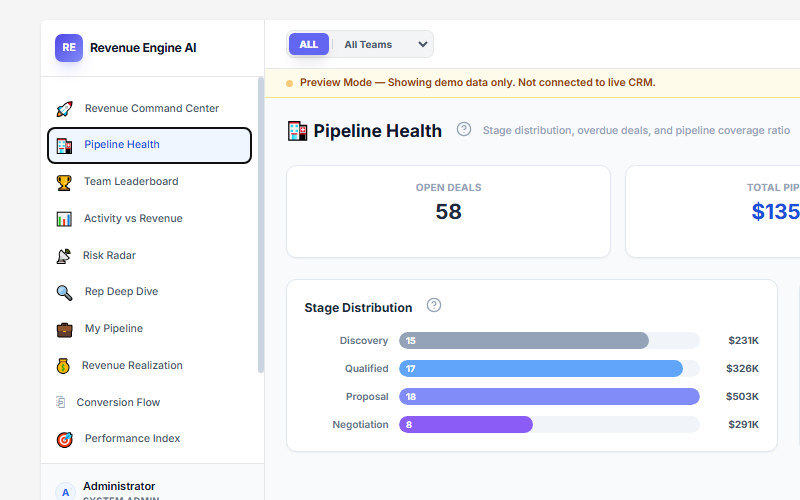
The Pipeline Health view provides a stage-by-stage analysis of your current opportunities. It is designed to highlight where deals are accumulating and where they are failing to progress.
Visual Distribution
The interface uses horizontal distribution bars to show the number of deals and total values across key pipeline stages:
- Prospecting / Discovery
- Qualification
- Proposal
- Negotiation
- Closing
Identifying Stalls
Revenue Engine AI identifies bottlenecks through stage duration analysis. If a specific stage — such as Negotiation — shows a high volume of deals but low conversion to the next stage, it indicates a process gap requiring immediate attention.
Action Triggers
- Bottleneck in Proposal Stage: Target proposal quality for review. Are reps sending proposals to poorly qualified prospects?
- Negotiation Low Conversion: Focus on pricing strategy and stakeholder alignment.
- Qualification Drop-off: Review qualification criteria and competitive positioning if conversion falls below acceptable thresholds.
Monitoring the Pipeline Coverage Ratio
The Pipeline Coverage Ratio is a critical KPI that determines whether hitting the quarterly revenue target is feasible. It is calculated by dividing Total Open Pipeline by the Quarterly Revenue Target set in system configuration.
Coverage Benchmarks
| Coverage Ratio | Status | Business Implication |
|---|---|---|
| 3.0x – 4.0x+ | Healthy | Standard ratio to comfortably hit targets |
| < 2.0x | Low | Insufficient pipeline — consider a pipeline generation sprint |
| < 1.0x | Critical | Revenue target is at extreme risk — escalate immediately |
Action Trigger: Ratio below 2.0x → immediately launch a pipeline generation sprint or review lead sources to de-risk quarter-end targets.
Top Accounts and Concentration Risk Alerts
The Account Intelligence view (🏢 icon in sidebar) shifts focus to your most valuable relationships, ranking the top 12 accounts by total pipeline value. This helps revenue leaders identify Concentration Risk — when a majority of the quarter’s revenue depends on too few clients.
Account-Level KPI Tiles
Revenue Engine AI tracks four specific KPIs in this view:
- Accounts in Pipeline: Total count of unique accounts with open opportunities.
- Top-3 Concentration %: The percentage of the total pipeline held by the three largest accounts.
- High-Risk Accounts: Accounts containing at least one deal flagged with a high-risk badge (overdue close date, rep inactivity, or overstated probability).
- Avg Deal / Account: The average value of opportunities per client.
Concentration Risk Alert
The system displays a concentration bar showing each account’s percentage share of the total pipeline. A Concentration Alert banner is automatically triggered when the top three accounts together exceed 50% of the total pipeline value.
Accounts are tagged with a “⚠ Risk” badge if they contain deals flagged by the built-in engine for overdue close dates, rep inactivity, or an optimism gap (discrepancy between deal stage and probability).
Action Triggers
- Concentration Alert Visible: Diversify sales efforts to reduce over-reliance on top accounts. Assign more pipeline generation activity to mid-tier accounts.
- High-Risk Account Flagged: Schedule a mandatory review of all deals associated with that account — especially those with a close date within the current quarter.
Data-Driven Navigation & Filtering
Both views respect the global filtering system, ensuring that insights are relevant to the specific user:
- Team Filter: View pipeline health and account distribution for specific security groups or departments.
- Date Range Filter: Analyse pipeline states for “This Quarter,” “Last Month,” or a custom date range.
- Role-Based Visibility:
- Admins — full organisational pipeline and all accounts
- Managers — pipeline and accounts within their assigned team
- Reps — their own deals and associated accounts
Reporting and Export
Use the export toolbar to share these views with leadership or in formal reviews:
- PNG: High-resolution screenshots for quick sharing in Slack or internal memos.
- PDF: A4 landscape format suitable for formal quarterly business reviews.
- CSV: Available for Pipeline Health deals — enables offline filtering and analysis.
- Email: Pre-formatted subject line for distributing insights to leadership.
Revenue Engine AI v1.7.2 · Built by Zybroz · support@zybroz.com