
Mastering Forecast Accuracy & Revenue Realization in SuiteCRM
Sales leadership often struggles to pinpoint exactly why a quarter was missed — or to identify where revenue disappears between a signed quote and a deposited payment. Manual spreadsheets are static, prone to error, and offer no historical context for how a forecast evolved over time.
Revenue Engine AI solves this by providing a dedicated environment for high-precision forecasting and quote-to-cash analysis. By combining the Forecast Accuracy Tracker with the Revenue Realization Funnel, sales organisations can move from “guessing the number” to a scientific understanding of their revenue trajectory — with zero hidden leakage.
Saving and Tracking Forecast Snapshots
Predictability is built on historical context. The Forecast Accuracy Tracker (indicated by the 🎯 icon in the sidebar) allows managers to move beyond real-time totals by capturing exactly what the forecast looked like at specific moments in time.
How the Forecast is Calculated
The system uses the Built-in Intelligence Engine to compute a deterministic projection. Unlike basic CRM reports, this calculation includes:
- Closed Revenue: Actual won deals within the period.
- Weighted Pipeline: Open opportunities multiplied by their stage probability.
- Recency Discount: A penalty factor applied to deals with no activity for an extended period, ensuring that “stale” pipeline does not inflate the projection. (The specific discount rate is an internal implementation detail.)
- Projected Total: The sum of closed revenue and the discounted weighted pipeline.
Step-by-Step: Saving a Forecast Snapshot
Snapshots capture the current forecast state — closed revenue, weighted pipeline, and projected total — and store it with a timestamp so you can compare it against future snapshots.
- Navigate to Forecast Accuracy Tracker in the sidebar (🎯 icon).
- Confirm the date range in the header matches the period you want to snapshot (e.g., “This Quarter”). The KPI tiles will reflect the chosen period.
- Review the four KPI tiles at the top of the view: Closed (with attainment %), Weighted Pipeline (stage-prob × recency), Projected Total (% of target), and Forecast Gap (value range). Confirm values are current.
- Click the Save Snapshot button (top-right of the Forecast Accuracy view).
- A confirmation prompt appears. Click Confirm to save.
- A new row immediately appears in the Snapshot History table showing today’s date, Closed, Weighted, Projected, Att%, and a rating badge (on track / at risk / behind).
Best practice: Save a snapshot at the same point each week — for example, every Monday morning before pipeline reviews. Consistent timing makes the snapshot-to-snapshot delta meaningful. Ad hoc snapshots taken at different times of day or week introduce noise into the trend.
Step-by-Step: Comparing Two Snapshots
The Snapshot History table is where forecast accuracy becomes actionable. Each row is a point in time; reading them top-to-bottom tells you whether the quarter is improving or deteriorating.
- Scroll down to the Snapshot History table beneath the KPI tiles.
- Identify the two snapshots you want to compare — typically the most recent row versus the previous week’s row.
- Look at the Snapshot Delta (↑↓) column — this shows the percentage-point change in Projected Total between the two rows.
- Read the Rating Badge change across rows: moving from on track → at risk → behind indicates a deteriorating forecast; reverse direction indicates recovery.
- For a deeper dive, note the individual changes in Closed Revenue and Weighted Pipeline between rows. A rising Closed Revenue with a falling Weighted Pipeline is healthy (deals are closing as expected). A falling Weighted Pipeline with flat Closed Revenue signals deal slippage.
Understanding the Recency Discount
The Projected Total is not a simple sum of weighted opportunities. The built-in engine applies a recency discount — a penalty to open deals that have shown no activity for an extended period.
- What it does: Reduces the effective weight of stale pipeline in the projection, preventing old deals with zero recent activity from inflating the forecast number.
- Why it matters: A rep might have 15 “open” deals but not have touched 10 of them in 30+ days. Without a recency discount, the forecast would count those stale deals at full probability weight — creating false confidence.
- How to read it: If your Weighted Pipeline appears lower than a manual sum of (Amount × Stage probability) would suggest, the recency discount is working as intended — stale pipeline is being discounted.
- How to improve it: Log activity against stale deals (calls, meetings linked to the opportunity) to reduce the discount applied. Alternatively, disqualify deals that genuinely cannot close this period to clean the pipeline and restore forecast accuracy.
Data Retention: Revenue Engine AI stores up to 20 snapshots in the browser’s
localStorage. When the limit is reached, the oldest snapshot is automatically removed. For long-term archiving, export the Forecast Accuracy view as a PDF or CSV before snapshots roll off.
Interpreting Forecast Metrics
| Metric | Description | Action Trigger |
|---|---|---|
| Forecast Gap | Difference between Projected Total and Quarterly Target | If gap exceeds 20% of target mid-quarter, trigger a pipeline generation sprint |
| Attainment % | Closed Revenue ÷ Quarterly Target | Monitor against time elapsed in the quarter to confirm you are on pace |
| Snapshot Delta (↑↓) | % point change in Projected Total vs previous snapshot | A downward delta indicates deal slippage or reduced activity levels |
Rating Badges
Each snapshot row shows a rating badge based on projected attainment vs target:
- on track: Projected attainment meets or exceeds the target — no action needed.
- at risk: A gap exists between projected total and target — monitor closely and consider pipeline generation or deal acceleration.
- behind: Significant gap; target is unlikely to close without substantial pipeline changes — escalate immediately.
The Quote-to-Cash Realization Funnel
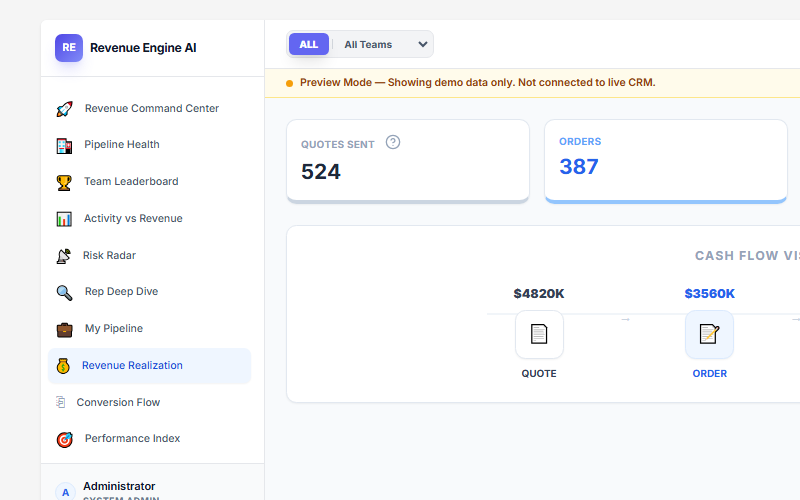
While the Forecast Accuracy Tracker tells you what might happen, Revenue Realization tells you what is actually happening as money moves through your financial process. This view visualises the commercial journey from a Quote to collected Cash.
The Four Realization Stages
The funnel tracks four distinct stages of a deal’s financial life cycle:
- Quotes: The total value of commercial offers sent to prospects.
- Orders: Confirmed commitments where a quote has been accepted.
- Invoices: Requests for payment issued to the customer.
- Collected: Actual cash received and recorded in the CRM.
Each step displays the actual value and the conversion rate from the preceding step, making it immediately clear where value is leaking.
Identifying Financial Leakage
Leakage occurs whenever the value drops significantly between two steps of the realization funnel. By identifying the specific gap, you can determine which team needs to take action.
Interpreting Drop-Offs
- Quotes → Orders (The Sales Gap): A large drop here indicates a closing problem. Reps may be over-quoting unqualified prospects, or struggling to finalise negotiations.
- Orders → Invoices (The Billing Gap): A drop here suggests a bottleneck in the administrative or finance process. Orders are being won, but the paperwork to trigger payment isn’t being completed promptly.
- Invoices → Collected (The Collections Gap): This is the most critical form of leakage. Revenue has been earned but not yet collected — a direct cash flow risk.
Action Trigger: The 70% Rule
The Realization Rate is measured as the overall conversion from Quotes to Collected cash.
Critical Threshold: If the overall Realization Rate falls below 70%, it signals systemic inefficiency in the quote-to-cash process.
Action: Immediately escalate to the Finance department for a collections review, and conduct an operational review of the billing process to identify where the bottleneck lies.
How Realization Connects to the Performance Index
Correction from previous version: An earlier version of this document incorrectly stated that “Revenue Realization accounts for 40% of the Rep Performance Index.” This is not accurate.
The Performance Index is driven by Revenue Attainment (closed-won revenue vs the rep’s individual quarterly target) — not the Realization funnel conversion rate. The four Performance Index components are:
- Revenue Attainment — 40%
- Conversion Rate — 30%
- Activity Volume — 20%
- Risk Penalty — −10%
The Revenue Realization view is a separate financial health indicator, primarily used by Finance and Sales leadership to track the quote-to-cash cycle rather than to score individual rep performance.
Revenue Engine AI v1.7.2 · Built by Zybroz · support@zybroz.com