
Team Leaderboard & The Performance Index
Manual sales reporting often forces managers to spend hours exporting data to spreadsheets to identify top performers. This process is slow, prone to error, and usually accounts for only a single dimension: revenue. Revenue Engine AI replaces this manual labour with a real-time, multi-factor ranking system that provides instant visibility into team health and individual representative efficiency.
By shifting focus from raw revenue to a weighted Performance Index, sales leaders can distinguish between reps who are closing through consistent high-volume activity and those who may be relying on a few large deals. This view allows managers to move from oversight to high-impact coaching.
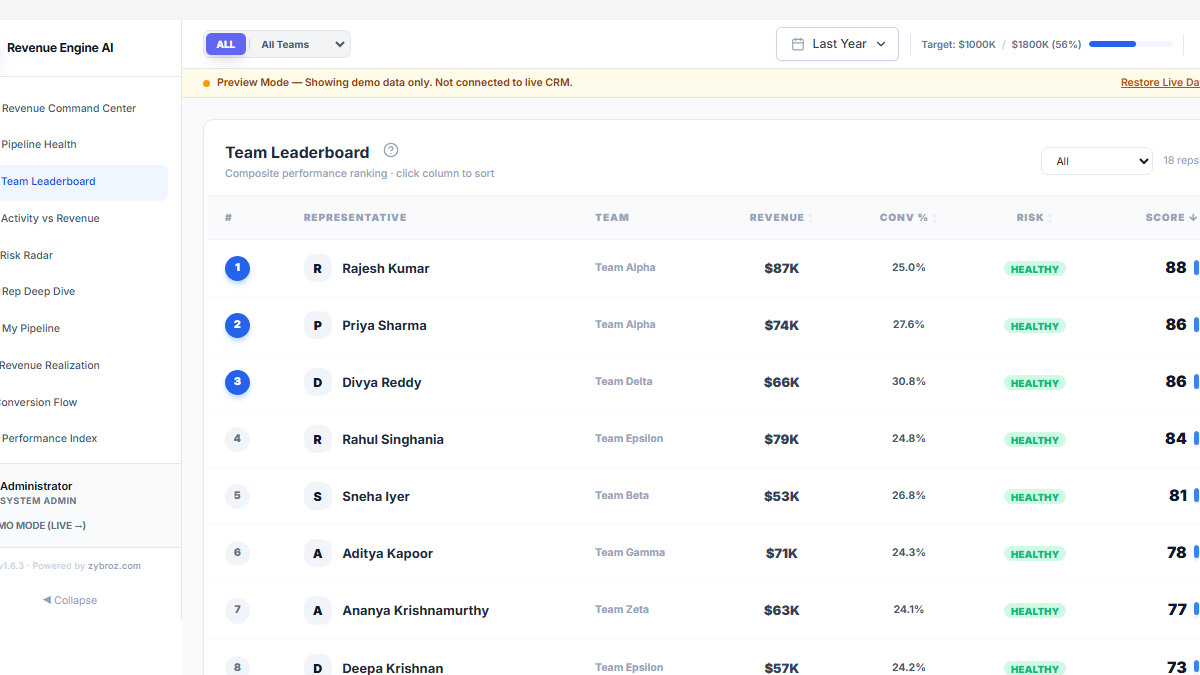
How the Performance Index is Calculated
The Performance Index is a composite score ranging from 0 to 100. It is designed to be a fairer metric than revenue alone, rewarding representatives who maintain high activity levels and conversion efficiency — even during months when they haven’t closed a major deal.
The score is derived from a weighted algorithm that balances leading indicators (activity) with lagging indicators (revenue):
| Metric | Weight | Description |
|---|---|---|
| Revenue Realized | 40% | Cash in bank — closed-won revenue for the period vs the quarterly target. This is the primary revenue contribution metric. |
| Conversion Rate | 30% | Efficiency of the closing process — how many leads or opportunities are successfully converted to won deals. |
| Activity Volume | 20% | Leading indicators including calls, meetings, and tasks logged against opportunities. |
| Risk Penalty | −10% | A negative deduction based on CRM hygiene: stalled deals (no stage change in 14+ days) and inactivity (no calls/meetings in 7+ days). |
Action Trigger: Performance Analysis
- High Index / Low Revenue: These reps are working hard and converting efficiently — they are likely one good deal away from the top of the leaderboard. Support their pipeline generation efforts.
- Low Index / High Revenue: These reps may be relying on a single large account or legacy deals. Investigate activity levels to ensure their pipeline is sustainable next quarter.
- Bottom 3 Reps: Use the index to identify bottom performers for a scheduled coaching 1:1 to address specific bottlenecks in activity or conversion.
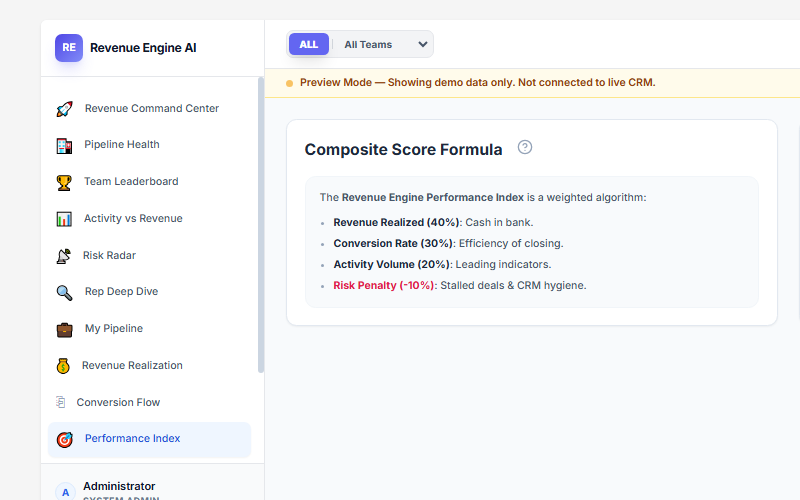
Sorting and Filtering the Leaderboard
The dashboard provides granular controls to help managers navigate large sales organisations. Whether managing a small group or an enterprise hierarchy of 50+ reps, the sorting and filtering tools ensure relevant data is always accessible.
Leaderboard Columns
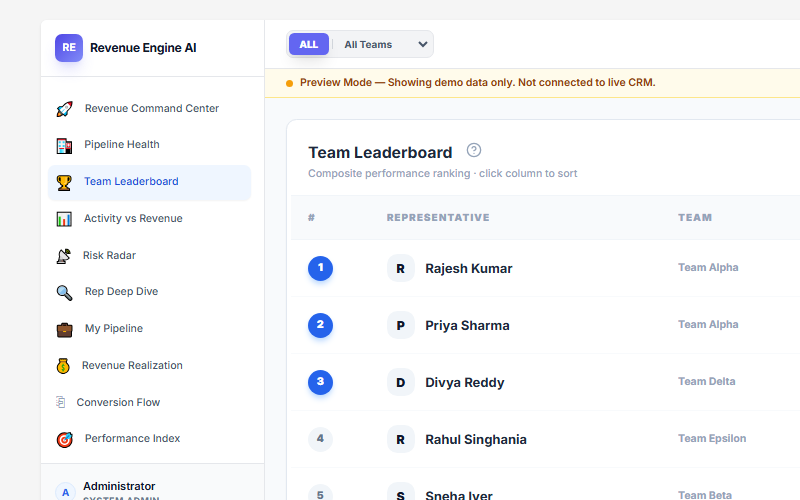
The leaderboard displays the following columns for each rep:
- # — Current rank by Score (default sort)
- Representative — Rep name with avatar initial
- Team — Security group / team assignment
- Revenue — Closed-won revenue for the selected period
- Conv % — Opportunity-to-closed-won conversion rate
- Risk — Badge showing pipeline health: HEALTHY (green), WARNING (amber), or RISK (red) based on stall count and inactivity
- Score — The composite Systems Index score (0–100) — the primary sort column
Sorting the Leaderboard
Click any column header to toggle between ascending and descending order:
- Sort by Revenue: View the headline ranking of who has contributed most to the bottom line.
- Sort by Score: See the most well-rounded performers based on the composite algorithm (default).
- Sort by Conv %: Surface reps who are converting a high proportion of their pipeline.
- Sort by Risk: Bring reps with RISK or WARNING badges to the top for immediate coaching focus.
Filtering and Navigation
- Team Filter Dropdown: Located at the top of the view, this isolates a specific team (e.g., Team Alpha, Team Beta) to compare peers within a single group.
- Rep Zoom: Clicking on any representative’s row immediately opens the Rep Deep Dive view for that individual’s KPIs, active deal list, and coaching flags.
- Pagination: The leaderboard is paginated at 10 representatives per page. Use the Prev/Next buttons at the bottom to browse the full organisation. The CSV export captures all reps across all pages.
Persistence and Role-Based Access
- Filter Persistence: The last selected team filter is saved to local storage, keeping the view consistent after a page reload.
- Data Visibility: The leaderboard automatically respects SuiteCRM role-based access:
- SuiteCRM Admins — see all representatives across all teams
- Security Group Admins (Managers) — see only reps within their assigned security group
- Regular Reps — see only their own data
Exporting the Leaderboard
The Leaderboard supports a full CSV export that captures all representatives across all pages — not just the current page view. This is ideal for offline analysis, HR reviews, or importing into compensation planning tools.
PNG and PDF exports are also available via the Export Toolbar for quick sharing or board-ready reporting.
Revenue Engine AI v1.7.2 · Built by Zybroz · support@zybroz.com