
The Revenue Command Center: Master SuiteCRM Performance
Sales managers and VPs often spend hours manually extracting SuiteCRM data, formatting spreadsheets, and identifying trends before weekly meetings. The Revenue Command Center eliminates this manual burden by providing a real-time, high-fidelity “God View” of organisational health.
- The Problem: SuiteCRM’s native reports are static and slow, requiring manual pivots to identify which reps are stalling or where the forecast gap lies.
- The Solution: An automated, AI-narrated dashboard that centralises organisational KPIs, pipeline signals, and revenue velocity into a single actionable screen.
- The Outcome: Managers act on data-driven insights immediately, identifying bottlenecks before they impact the quarterly number.
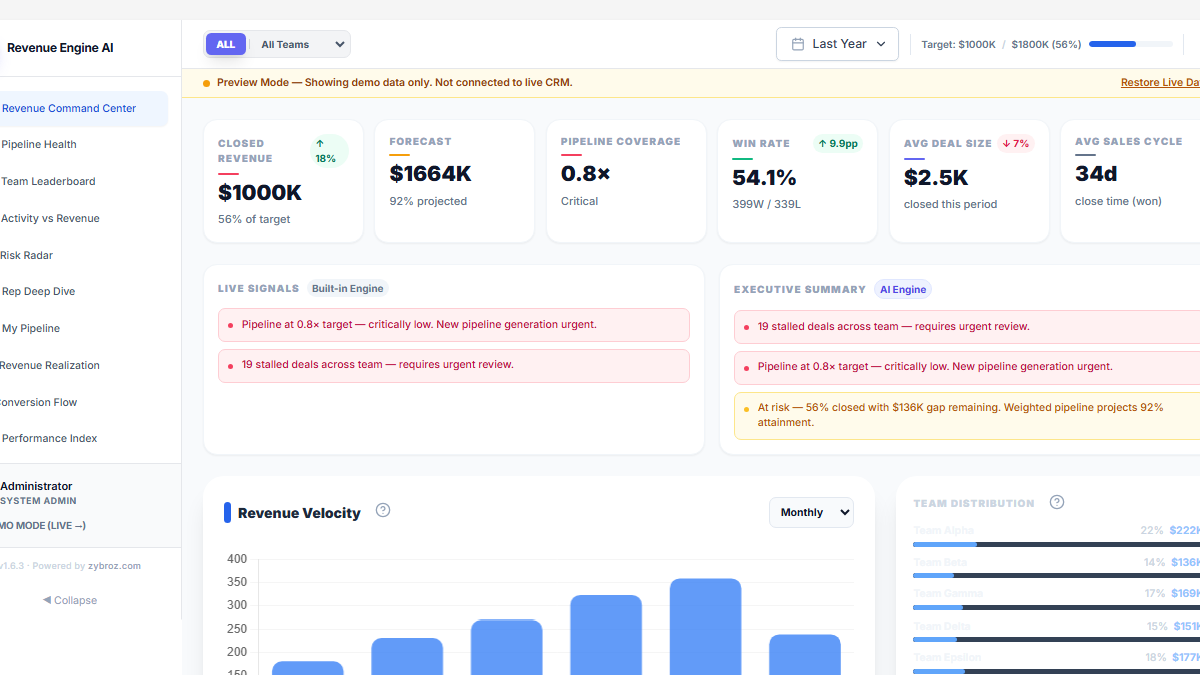
The 6 KPI Tiles & Period-over-Period Deltas
The top of the Revenue Command Center features six mission-critical metrics that define organisational health. These tiles provide an instant pulse on whether the sales engine is meeting its targets.
KPI Breakdown
- Closed Revenue: Total won revenue for the selected period, with a subtitle showing progress against the Quarterly Revenue Target (e.g., “56% of target”).
- Forecast: A predictive metric combining closed revenue with the weighted pipeline. Color-coded: Emerald = on track, Amber = at risk, Rose = behind.
- Pipeline Coverage: Open pipeline divided by the remaining target gap. Status labels: Healthy (3x–4x+), Low (<2x), Critical (<1x).
- Win Rate: Calculated as Won ÷ (Won + Lost). Provides a realistic view of closing efficiency.
- Avg Deal Size: The average value of all Closed Won deals in the selected period.
- Avg Sales Cycle: The average number of days from deal creation to “Closed Won.”
Period-over-Period Deltas
Introduced in v1.5.0, specific tiles feature trend badges comparing current performance against the same-length prior period:
- Revenue Delta: Percentage increase (Emerald ↑) or decrease (Rose ↓) vs prior period.
- Win Rate Delta: Displayed in percentage points (pp).
- Avg Deal Size Delta: Percentage fluctuation vs prior period.
Action Trigger: If Pipeline Coverage drops below 2.0x, escalate pipeline generation efforts immediately. If Win Rate drops by more than 5pp, review qualification criteria and deal-closing process.
Interpreting AI Engine Executive Narratives & Live Signals
The middle section of the dashboard is powered by the Built-in Intelligence Engine. Unlike standard dashboards, Revenue Engine AI does not just show numbers — it interprets them.
Executive Narratives
The Built-in Engine generates a deterministic narrative that prioritises what the manager needs to know:
- Contextual Analysis: The engine analyses the forecast gap and projected attainment.
- Plain-English Coaching: Instead of raw data, managers receive bullets such as “19 stalled deals across the team require urgent review.”
- LLM Integration: If a BYOK key (Google Gemini, OpenAI, or Anthropic) is configured, the narrative becomes richer — providing executive-grade summaries and specific recommended actions.
Live Signals Panel
The Signals Panel highlights operational risks using colour-coded indicators (Rose = high severity, Amber = medium, Green = healthy). The built-in intelligence engine monitors 9 named signals in real time. Each signal has a precise trigger condition derived directly from your SuiteCRM data:
| Signal | Severity | Trigger condition | Recommended action |
|---|---|---|---|
| COVERAGE_CRITICAL | 🔴 High | Pipeline coverage ratio falls below 1× target — you have less open pipeline than the remaining revenue goal | Immediate pipeline generation campaign. Review inactive leads and reopen stalled deals. Escalate to sales leadership. |
| OVERDUE_DEALS | 🔴 High | One or more open opportunities have a close date in the past | Push the close date forward with a concrete next action, re-qualify the deal, or disqualify if there is no realistic path to close. Overdue deals inflate pipeline and distort forecasts. |
| HIGH_STALL_COUNT | 🔴 High | More than 5 deals across the team have had no stage change for 14+ days | Open Risk Radar for deal-level intervention. Run stall reviews in your next team meeting. Assign owners and set explicit re-engagement deadlines. |
| ZERO_PIPELINE_REPS | 🔴 High | One or more active reps have zero open pipeline (no opportunities with value > 0) | Immediate 1:1 with each affected rep. Determine whether this is a prospecting gap or a data entry issue (deals exist but have no Amount entered). Use Rep Deep Dive for context. |
| COVERAGE_LOW | 🟡 Medium | Pipeline coverage ratio is between 1× and 3× target — below the recommended healthy minimum | Increase prospecting activity and accelerate early-stage deals. Monitor weekly. Benchmark: 3×–4× coverage is considered healthy. |
| STAGE_CONCENTRATION | 🟡 Medium | More than 55% of total pipeline value is concentrated in a single stage | Investigate whether deals in that stage are genuinely progressing or accumulating without movement. Diversifying the stage distribution reduces forecast risk. |
| CLOSE_DATE_CLIFF | 🟡 Medium | More than 40% of pipeline value has a close date set to the current week | Lumpy close dates indicate push-to-end-of-period behaviour. Verify that each at-risk deal has a confirmed verbal or written commitment. Adjust close dates where the deal is not genuinely close to decision. |
| STALL_WARNING | 🟡 Medium | Between 2 and 5 deals across the team have had no stage change for 14+ days | Add these deals to your weekly review agenda. Assign a clear next step and deadline for each. If unresolved by next review, escalate to HIGH_STALL_COUNT territory. |
| COVERAGE_HEALTHY | 🟢 Good | Pipeline coverage ratio is 3× target or above | No action required — pipeline is in a healthy range. Use this as a baseline to maintain and shift focus to conversion quality and deal velocity. |
Action Trigger: Any Rose signal warrants same-day attention. Amber signals should be on your next weekly review agenda. The COVERAGE_HEALTHY signal is informational — acknowledge it and redirect focus to the conversion metrics in Team Leaderboard and Conversion Flow.
Analysing the Revenue Velocity Trend Chart
The Revenue Velocity chart provides historical context for current performance, allowing managers to see whether sales team momentum is accelerating or slowing down.
Key Features
- Trend Visualisation: A bar chart showing revenue performance over time, using daily history chunked into logical groups.
- Flexible Grouping: A dropdown allows users to toggle between Monthly and Quarterly views — essential for identifying seasonal trends or end-of-quarter patterns.
- Team Distribution Side-Panel: Adjacent to the chart, the Team Distribution widget shows revenue share and percentage labels for each team (e.g., Team Alpha, Team Beta), identifying which sub-groups are driving the most velocity.
Interpreting the Data
Look for “stair-step” growth in the bar chart. If the current month’s velocity is significantly lower than the previous month despite a healthy pipeline, it may indicate a bottleneck in the Revenue Realization (quote-to-cash) process.
Action Trigger: If velocity is trending downward while the Avg Sales Cycle is increasing, deals are becoming more complex or reps are losing efficiency. Use the Activity vs Revenue scatter plot to determine whether the issue is activity volume or closing technique.
Quick Reference: Command Center Features
| Feature | Purpose |
|---|---|
| Date Range Filter | Adjust the entire dashboard to a standard preset or custom date range |
| Team Filter | Scope the Command Center to a specific Security Group or department |
| Target Bar | View absolute Revenue vs Target values at a glance |
| PDF Export | One-click A4 landscape export for board meetings and QBRs (v1.7.2) |
| PNG Export | High-resolution 2x DPI screenshot for Slack or presentations (v1.7.2) |
| CSV Export | Available for Leaderboard and Pipeline Health views (v1.7.2) |
| Dark Mode | Moon/sun toggle in the header; persists to local storage (v1.7.1) |
Revenue Engine AI v1.7.2 · Built by Zybroz · support@zybroz.com