
It is Monday morning. A sales manager opens SuiteCRM, pulls five reports – calls logged last week, pipeline by stage, deals updated in the past seven days, revenue versus quota, open task count. An hour later they have a spreadsheet full of counts and totals. They identify one rep with low call volume and send a check-in message. By Friday, that rep’s two largest deals have gone cold, untouched for 11 days. The counts never flagged it. The SuiteCRM sales analytics behavioral metrics that would have surfaced it four weeks earlier were not in any of those reports.
This is the gap between lagging indicators and leading ones. Manual SuiteCRM reports tell you what already happened. Behavioral intelligence tells you what is happening right now – and where it is heading.
The Lagging vs Leading Indicator Gap
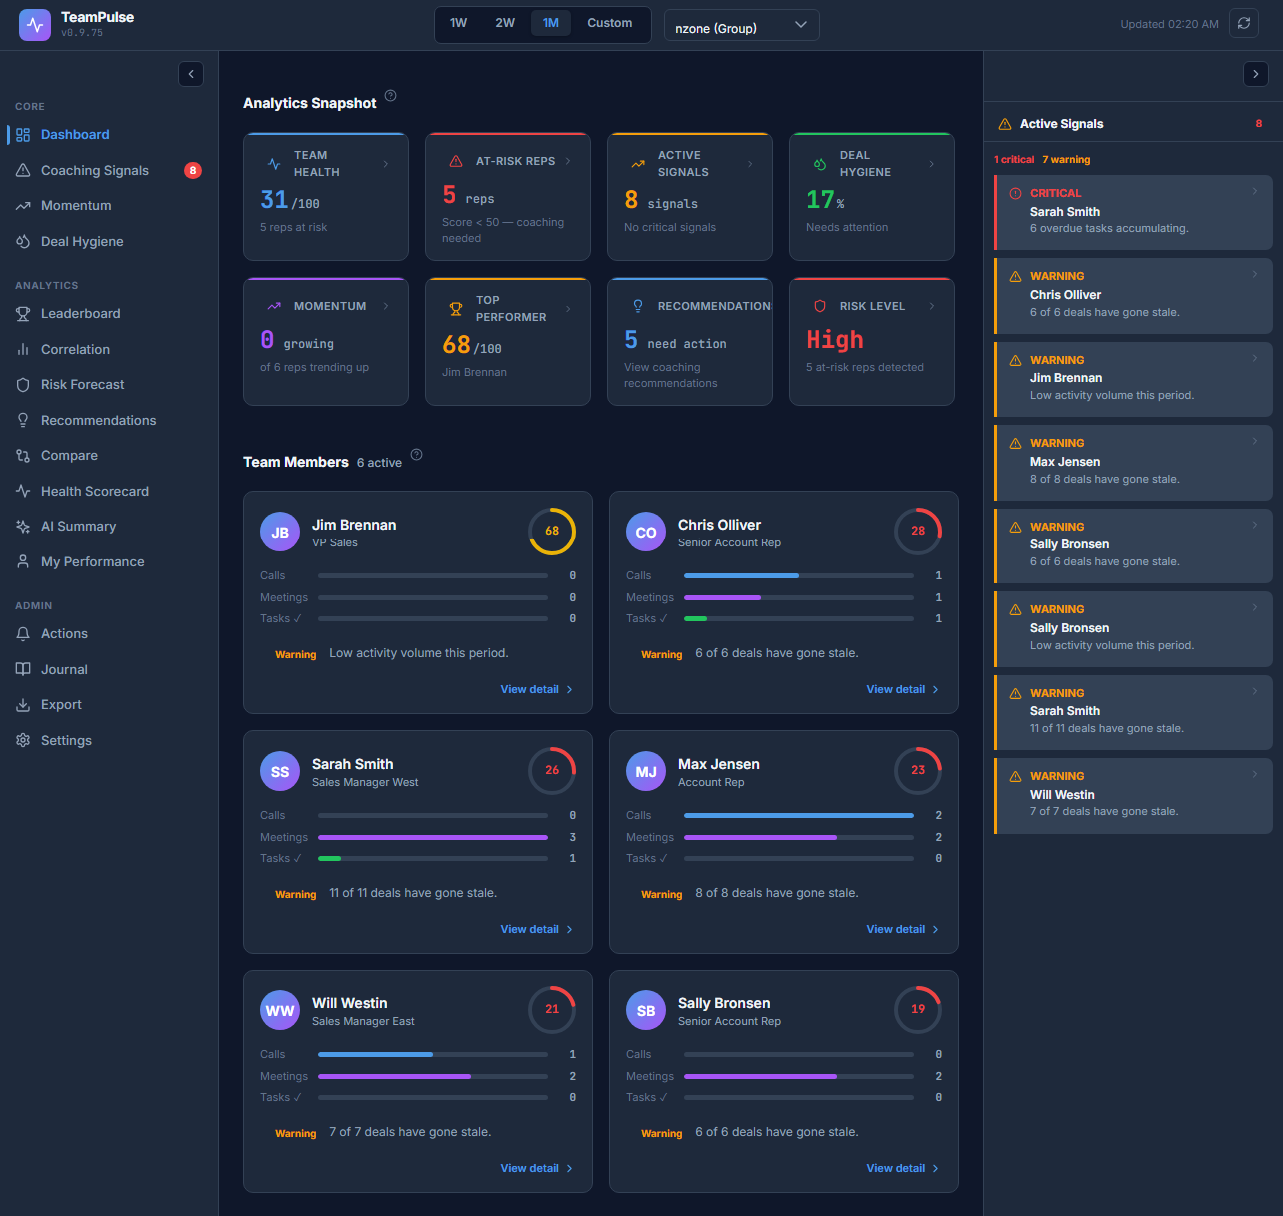
Traditional CRM reporting is built around outcomes: revenue closed, calls logged, deals in each pipeline stage. These are lagging indicators. By the time they move in the wrong direction, the behavioral breakdown that caused it has been compounding for weeks.
A rep’s quota miss in month three was caused by process failures in month one. Their follow-up cadence deteriorated. Open deals sat without activity. CRM records stopped being updated after calls. None of this appeared on a standard SuiteCRM report until the deals were already lost or stalled.
TeamPulse adds leading behavioral indicators to your SuiteCRM instance. It does not replace the native reports – it sits alongside them, measuring the process behaviors that determine whether next month’s revenue numbers will hold.
Side-by-Side: Manual SuiteCRM Reports vs TeamPulse Behavioral Metrics
| What you want to know | Manual SuiteCRM report | TeamPulse behavioral metric |
|---|---|---|
| Is the rep staying active on deals? | Calls logged this week (count) | Activity Continuity score – gap detection across rolling window |
| Is the pipeline real or stale? | Open pipeline value by stage | Deal Hygiene % – proportion of deals with recent, meaningful activity |
| Is the rep following up on time? | Overdue tasks count | Follow-up Consistency score (25% weight in Discipline Score) |
| Is the rep keeping records current? | Last modified date on records | CRM Update Frequency score – pattern of update regularity, not just recency |
| Is the rep’s overall process healthy? | Multiple reports manually cross-referenced | Discipline Score (0-100) – single composite behavioral rating |
| Is the rep trending better or worse? | Compare this month vs last month (manual export) | Momentum Tracker – directional trend indicator updated continuously |
| Which rep needs coaching now? | Manager judgment based on report review | Coaching Signals panel – at-risk reps flagged by score band and factor breakdown |
The Coaching Gap Manual Reports Cannot Close
Suppose a manager’s report shows that a rep closed 40% fewer deals this month compared to last. The report identifies the problem. It does not identify the cause. The manager schedules a 1-on-1. The conversation is general because the data is general.
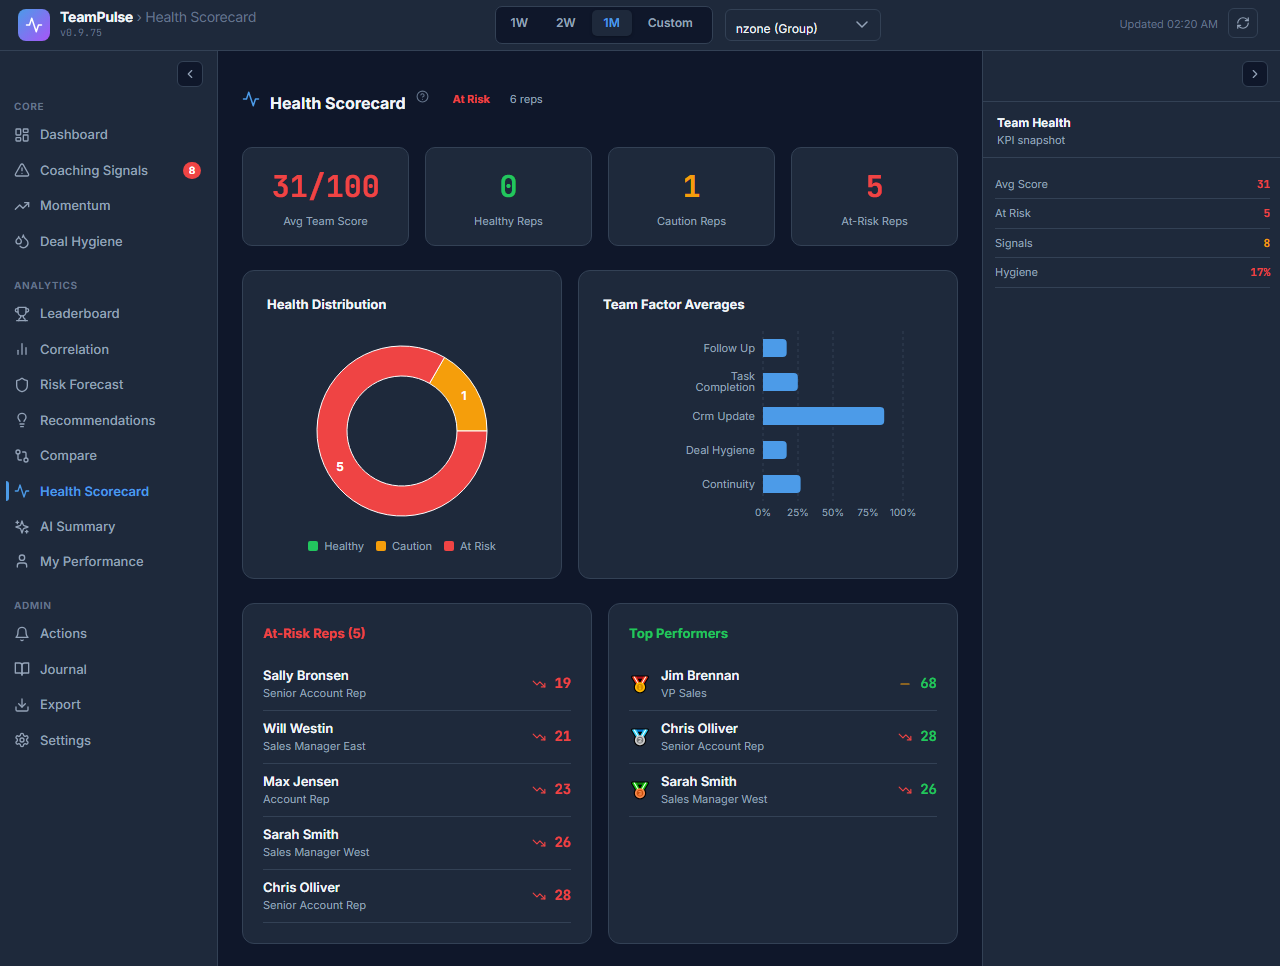
TeamPulse’s Discipline Score breaks behavioral health into five specific factors:
- Follow-up Consistency – 25% of the score
- Task Completion – 20%
- CRM Update Frequency – 15%
- Deal Hygiene – 20%
- Activity Continuity – 20%
When a rep scores 38 overall and the factor breakdown shows Follow-up Consistency at 12 and Deal Hygiene at 19, the coaching conversation has a specific target. The manager is not asking “what’s going wrong?” – they are addressing “your follow-up cadence has broken down on 60% of your deals.” That is a different conversation with a different outcome.
The Time-to-Detect Difference
By the time a rep’s revenue miss is visible in a SuiteCRM report, behavioral decline has already been underway for four to six weeks. A Discipline Score that drops below 49 – into the Critical band – surfaces that pattern in week one or two of the decline. The at-risk threshold is a trigger for early intervention, not a postmortem.
This is not theoretical. The five factors in the Discipline Score are the process behaviors that produce pipeline velocity. When Follow-up Consistency drops, deals stall. When Activity Continuity gaps appear, prospects disengage. The score captures these patterns as they form – not after the quarter ends.
What TeamPulse Does Not Do
TeamPulse is a behavioral analytics extension. It does not perform revenue forecasting, quota prediction, win-rate modeling, or financial analysis. It does not replace SuiteCRM’s native reporting for any of these use cases.
Revenue data stays in SuiteCRM. Behavioral health lives in TeamPulse. These are complementary layers, not competing ones. A manager who uses SuiteCRM’s pipeline reports alongside TeamPulse’s Discipline Scores has both outcome data and process data – the full picture instead of half of it.
Who TeamPulse Is Built For
TeamPulse is designed for sales managers and team leads who are already using SuiteCRM and want to move from reactive reporting to proactive coaching. It is not a replacement for the CRM. It is an intelligence layer that reads from the same data your team already enters – contacts, calls, tasks, opportunities – and surfaces behavioral patterns that standard reports cannot detect.
If you spend Monday mornings pulling reports and still feel like you are finding problems too late, the issue is not how many reports you pull. It is that the report format you are using was designed to measure outcomes, not behaviors.
Starting With Demo Mode
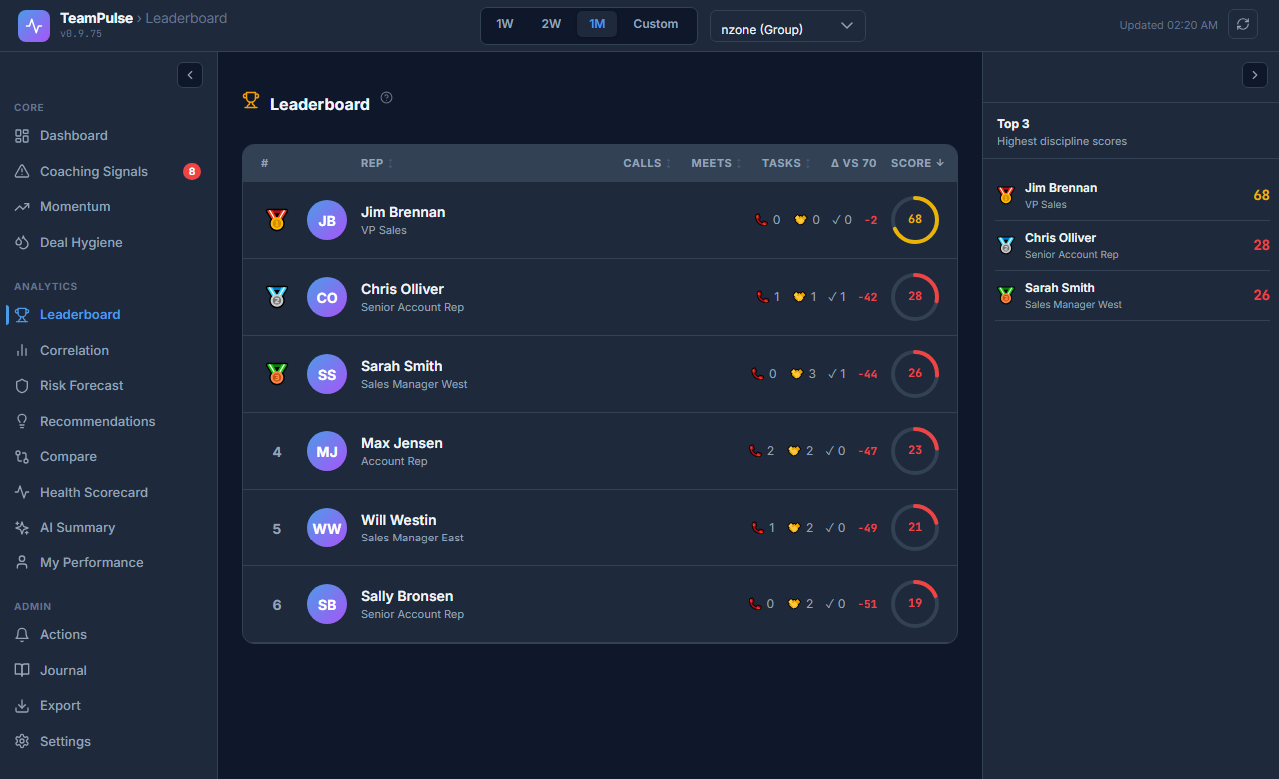
TeamPulse ships with a Demo Mode that loads 25 fictional reps across three teams – Midmarket, Enterprise, and SMB. Every Discipline Score, Coaching Signal, and Momentum indicator runs on this synthetic data. You can explore the full behavioral analytics system before connecting it to a single live CRM record.
This matters because the comparison above is abstract until you see a real score breakdown on a rep who mirrors your own team’s profile. Demo Mode makes that concrete in under five minutes after installation.
See behavioral scoring before you connect live CRM data. Install TeamPulse and explore Demo Mode – 25 reps, 3 teams, full behavioral analytics running on fictional data from the moment you log in.