

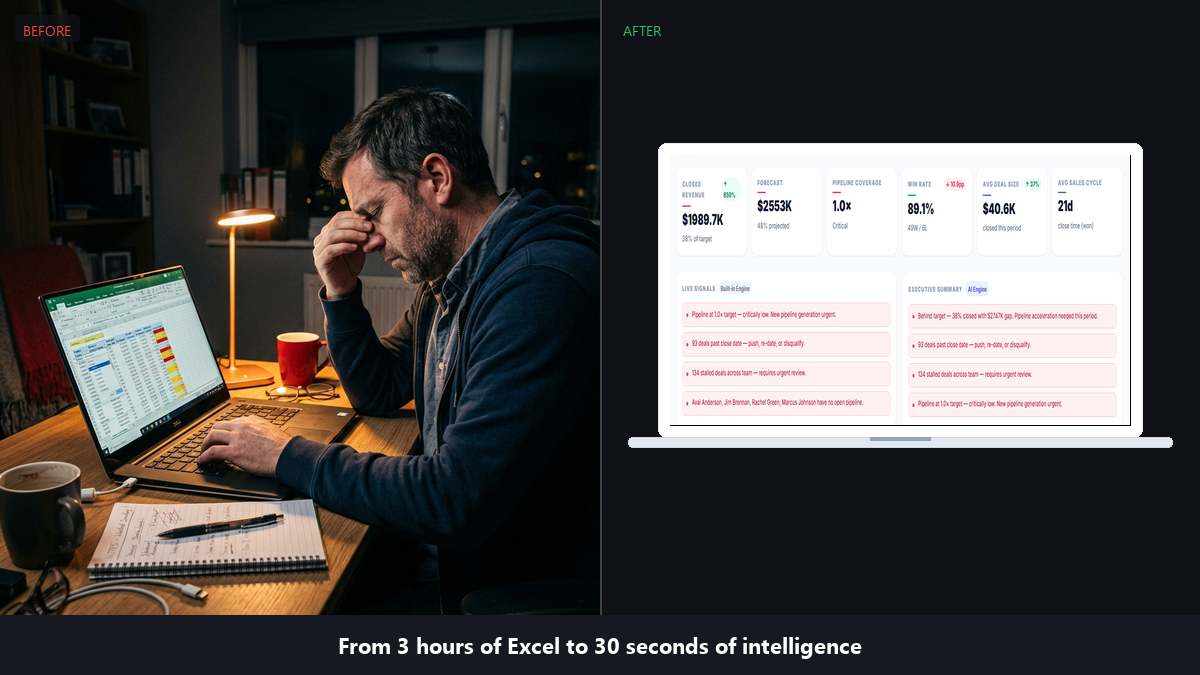
It’s Sunday evening. Your Monday standup is at 9 AM. Your VP wants the pipeline numbers by 8:30. So you open SuiteCRM, export the opportunities report to CSV, drag it into Excel, build the pivot table — again — and spend the next two hours formatting it into something that looks like an executive summary. By the time you close your laptop, it’s nearly midnight.
This is the Sunday Evening Trap. And if you manage a sales team on SuiteCRM, there is a very good chance you have been caught in it.
The Hidden Cost Your Finance Team Isn’t Tracking
Manual SuiteCRM reporting feels like “just part of the job.” But when you add up the hours, the picture changes quickly.
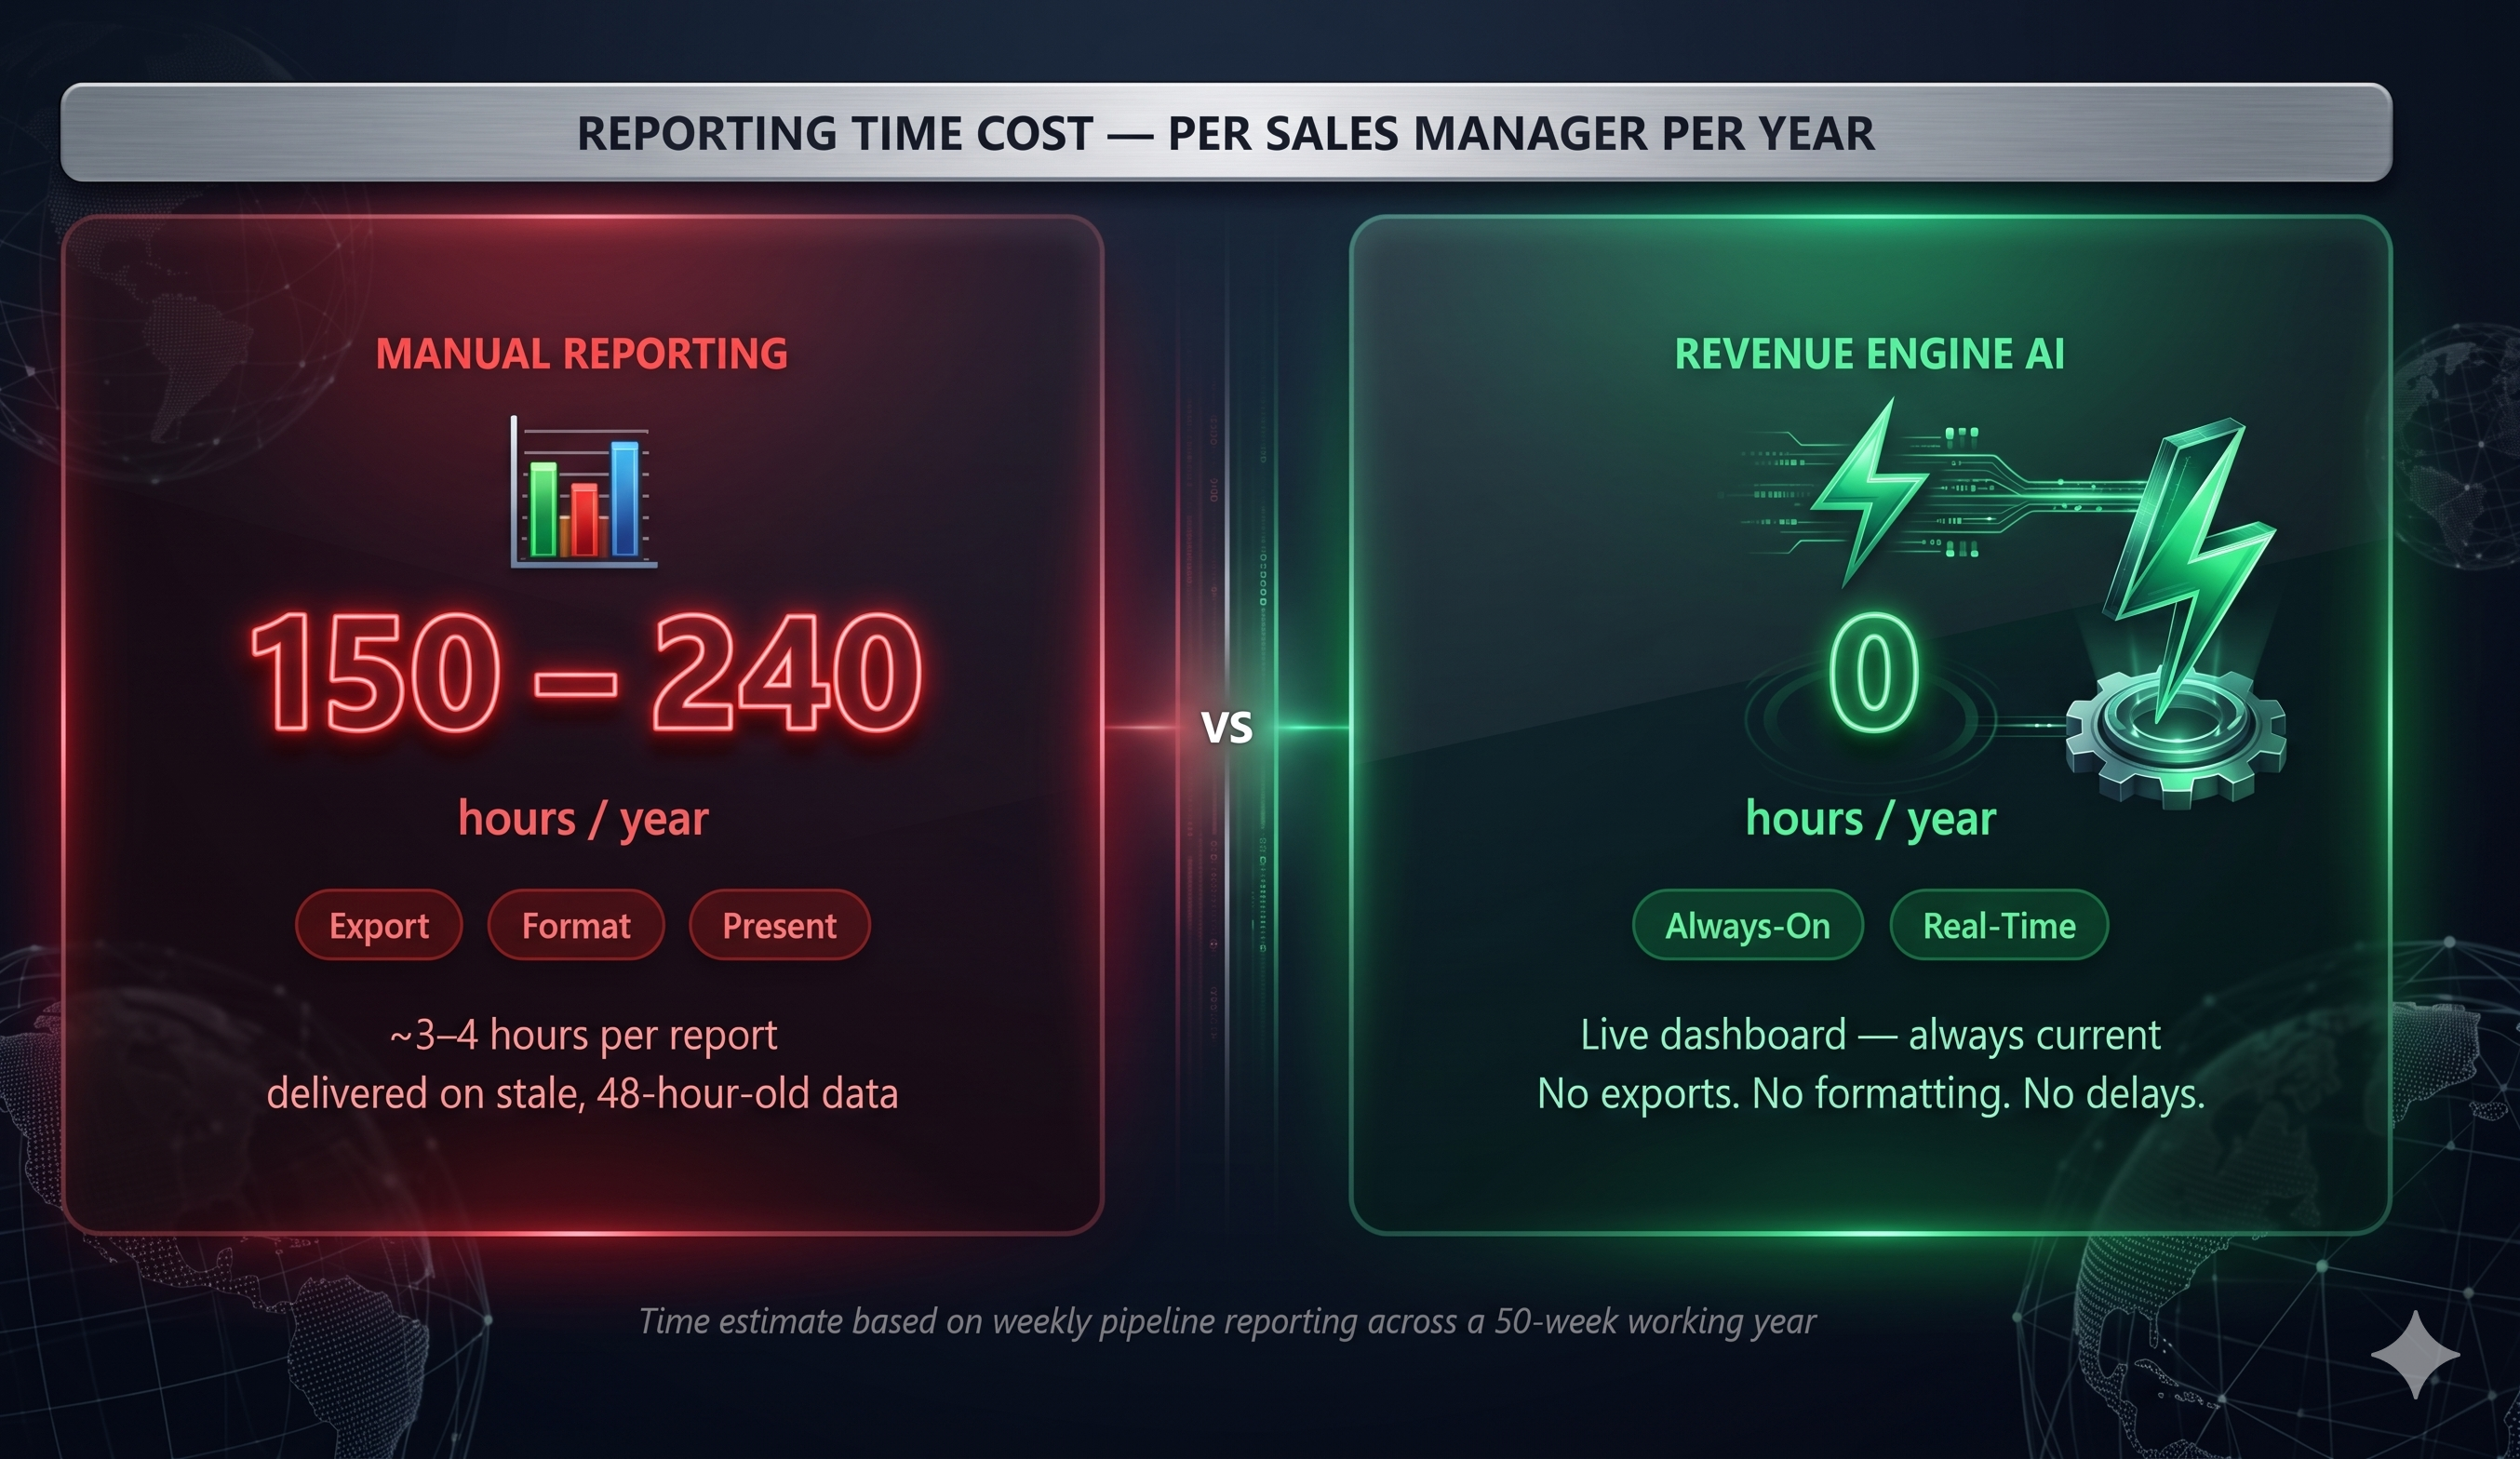
A typical sales manager spends between 3 and 5 hours per week pulling, cleaning, and formatting pipeline data. Across a 48-week working year, that is between 150 and 240 hours — effectively six full working weeks — spent on tasks that produce no revenue whatsoever.
In financial terms, that wasted time costs real money:
- India (Sales Manager salary ₹12L–₹20L/year): Manual reporting represents ₹3L–₹6L per manager per year in lost productive capacity
- UK (Sales Manager salary £40K–£55K/year): The equivalent cost runs between £3,750 and £5,000 per manager annually
- For a team of 3 managers: You are looking at ₹9L–₹18L (or £11K–£15K) in non-recoverable overhead — every single year
And this figure does not include the decisions made on stale data. By the time a manually compiled report reaches a Monday standup, the numbers are 24 to 48 hours old. In a fast-moving sales environment, that lag is where bad bets get made.
What You Are Actually Spending Time On
The Sunday Evening Trap isn’t just one problem — it’s a chain of small, repetitive tasks that compound into a serious operational drag:
- Exporting data: Running reports in SuiteCRM, downloading CSVs, waiting for slow queries on larger databases
- Cleaning the data: Removing duplicate rows, correcting currency formatting, handling null values in the Amount field
- Building the pivot table: Sorting by rep, by stage, by close date — then building the same table you built last week
- Formatting for humans: Colour-coding the cells, adding conditional formatting, writing a summary paragraph that your VP will read in 20 seconds
- Distributing the report: Emailing the Excel file, sharing it on Slack, updating the shared Google Sheet
None of this is analysis. It is data plumbing. And the real cost is the analysis that never happens because there is no time left after the plumbing is done.
The 48-Hour Data Lag Problem
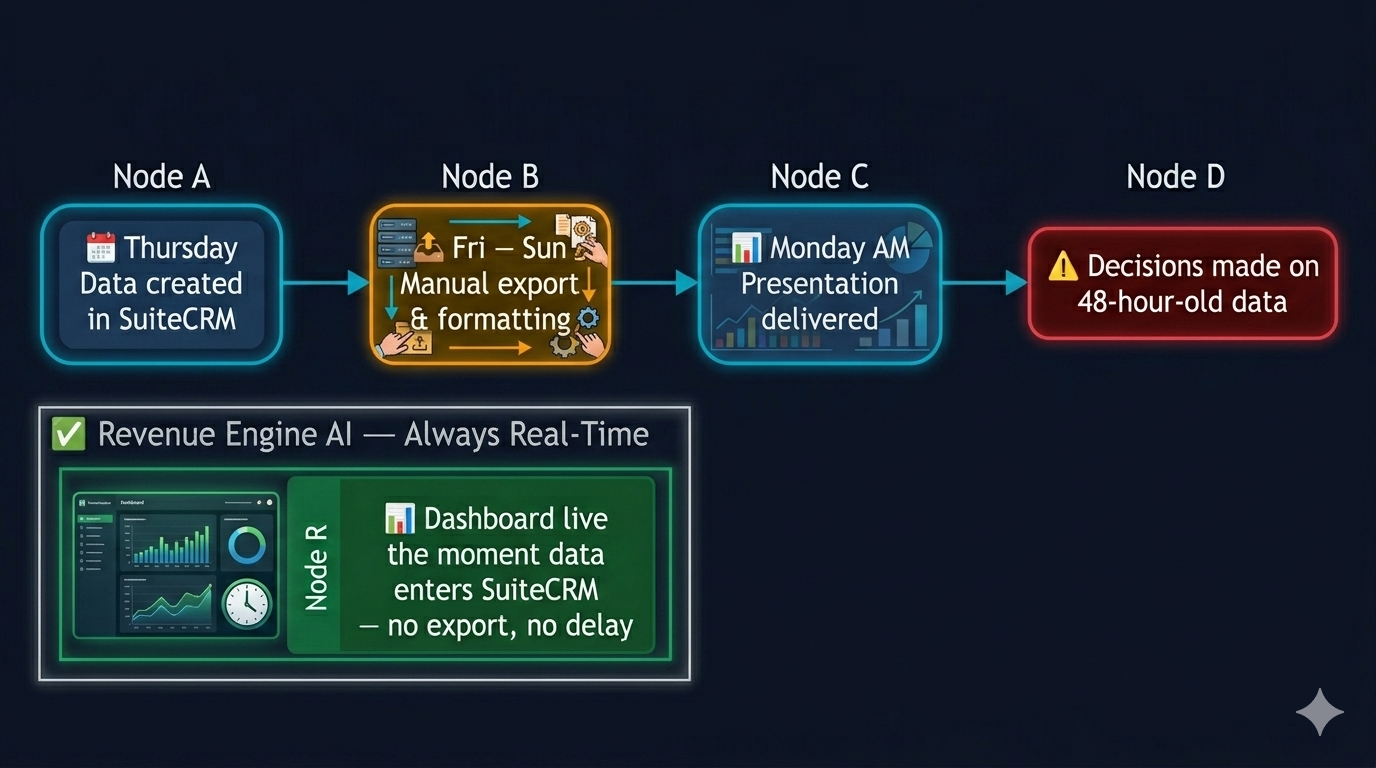
Here is a scenario that will sound familiar. A rep closes a deal on Thursday afternoon. Your manually compiled pipeline report — prepared the previous Sunday — still shows that deal as “Negotiation.” Your forecast is wrong. Your pipeline coverage looks better than it is. A decision made on that data is made on fiction.
SuiteCRM’s native reports run against live data, but they require someone to run them, format them, and distribute them. By the time that process completes, the data is already aging. In an organisation where deals close in days, not months, a 48-hour reporting lag is a competitive disadvantage.
The Real-Time Revenue Command Center
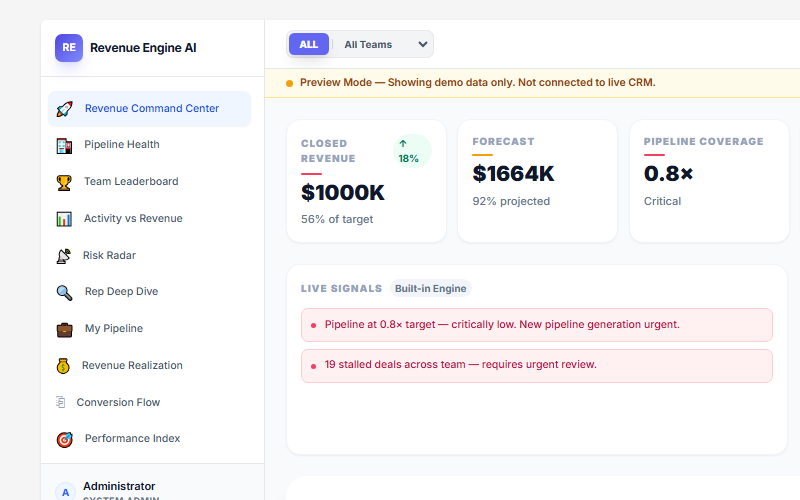
Revenue Engine AI is a sales intelligence extension for SuiteCRM 7.x that eliminates the reporting lag entirely. Instead of exporting and formatting, you open a single dashboard and the current state of your pipeline is already there — updated every time you load the page, no configuration required.
The Revenue Command Center view gives you six mission-critical KPIs at a glance:
- Closed Revenue — total won deals for the period, with % attainment against your quarterly target
- Weighted Forecast — projected total combining closed revenue and open pipeline with stage probabilities
- Pipeline Coverage — your open pipeline as a multiple of the remaining target gap
- Win Rate — Won ÷ (Won + Lost), calculated in real time from your SuiteCRM data
- Avg Deal Size — the SQL-computed average of all Closed Won deals in the period
- Avg Sales Cycle — average days from deal creation to close
Every tile updates the moment a deal moves in SuiteCRM. No exports, no pivots, no Sunday evenings.
Objective Team Evaluation with the Performance Index
Manual reporting has another hidden cost that is harder to quantify: subjective performance evaluation. When you are working from a spreadsheet, it is easy to rank reps purely by revenue — which rewards those who happened to close a large deal this quarter, and penalises those who are working hard on a healthy pipeline but haven’t landed a whale yet.
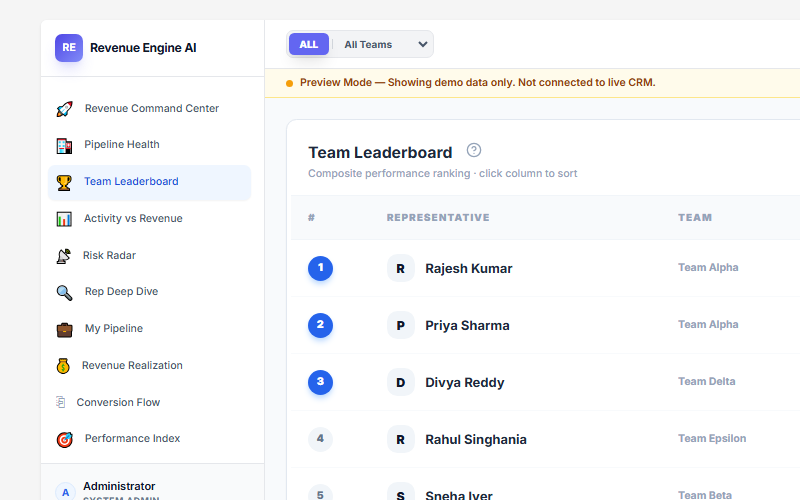
Revenue Engine AI introduces a Performance Index — a composite score from 0 to 100 that weights four factors:
- Revenue Attainment (40%) — closed-won revenue vs quarterly target
- Conversion Rate (30%) — how efficiently a rep moves opportunities to won
- Activity Volume (20%) — calls, meetings, and tasks logged against deals
- Risk Penalty (−10%) — deductions for stalled deals and CRM hygiene gaps
This means a rep who is doing everything right — high activity, high conversion rate, no stalled deals — shows a strong Performance Index even before they close a headline deal. It gives managers a defensible, data-driven basis for coaching conversations and performance reviews, rather than a revenue number that can be distorted by deal timing alone.
Zero Configuration. Five-Minute Install.
Revenue Engine AI installs via SuiteCRM’s standard Module Loader in under five minutes. It makes zero changes to your database schema — no tables are created or modified, no module registrations that could destabilise your CRM. It reads your existing SuiteCRM data (opportunities, users, activities, security groups) and presents it through the dashboard interface.
There is no BI tool to configure, no data warehouse to connect, no analyst to hire. You install it, set your quarterly revenue target, and the dashboard is live with your real pipeline data within minutes of installation.
What the Shift Looks Like in Practice
Before Revenue Engine AI, a typical Monday morning looked like this: the sales manager arrives with a spreadsheet, the standup covers last week’s numbers (already stale), and the next 30 minutes are spent debating what the correct pipeline figure actually is.
After Revenue Engine AI, the same manager opens the dashboard on their screen before the call. The numbers are current. The AI Insights panel has already generated a plain-English summary of pipeline health — which deals are stalling, which reps are behind on activity, where the forecast gap lies. The standup takes 15 minutes instead of 45, and it ends with a clear set of actions rather than a debate about data.
The Sunday Evening Trap disappears. Not because reporting becomes faster — but because it becomes unnecessary.
Start Reclaiming Your Weekends
Revenue Engine AI is available on the SuiteCRM Marketplace and directly from zybroz.com. It is compatible with SuiteCRM 7.12, 7.14, and 7.15, and requires PHP 7.4 or higher.
If your sales team is running on SuiteCRM and your managers are still spending Sunday evenings in Excel, the fix is a five-minute install away.
Questions? Contact us at support@zybroz.com.